
Trusted By Over 250,000 Customers!
No Interest, No Payments for 12 months on Select Products
No Interest, No Payments for 12 months on Select Products
On Halloween night, no two homes tell the same story. This year, we surveyed more than 2,000 Americans to uncover the homes where Halloween spirit truly thrives — and which states go all out to create magical, spooky, and candy-filled nights for their neighbors.
From quiet porches to full-blown haunted yards with glowing pumpkins and motion-sensor ghosts, our findings reveal the many ways families make their homes seasonal showpieces.
Halloween is a season when homes become canvases for creativity, and our survey shows just how invested Americans are in making their porches, windows, and yards come alive. More than three-quarters of Americans (76%) say they decorate their homes for Halloween, and 1 in 5 describe their efforts as “extensive,” going beyond a carved pumpkin or two to create full-on spectacles.
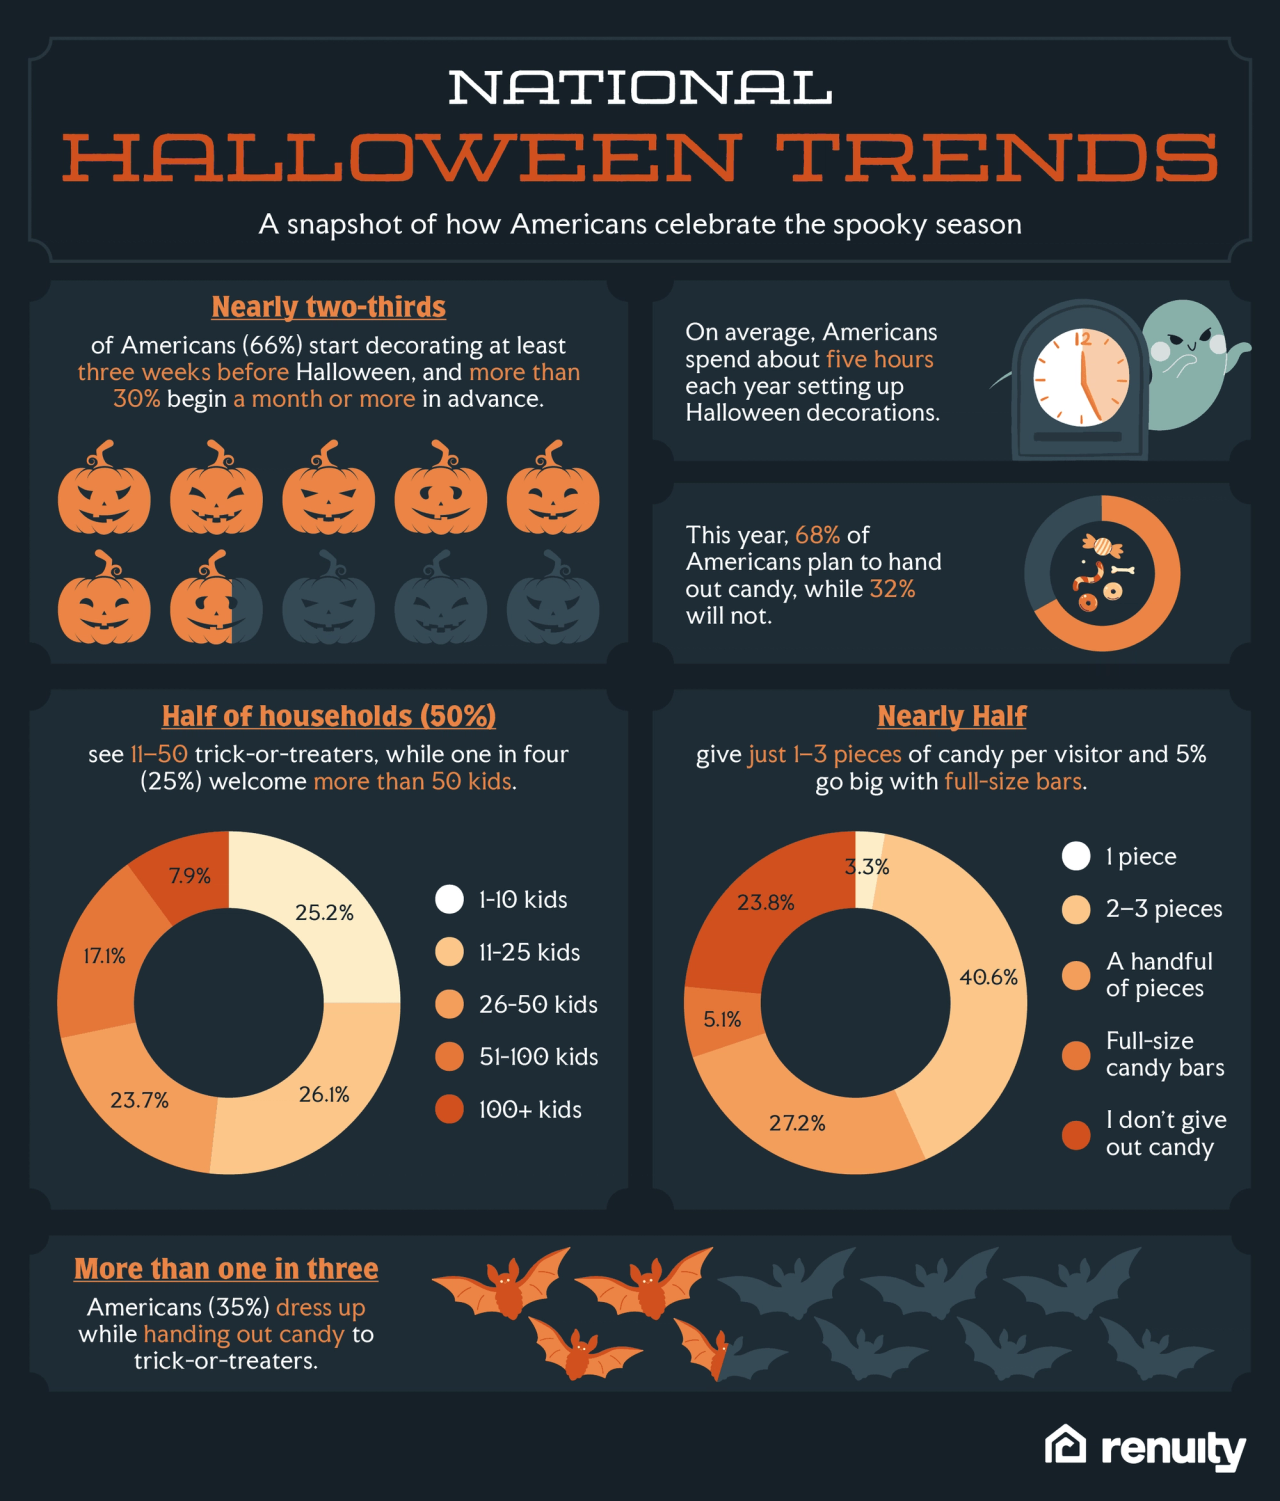
Americans say they spend the most money on Pumpkins (29%), yard inflatables (17%), and outdoor lighting (15%), proving that curb appeal takes center stage when it comes to spooky transformations. Nearly two-thirds of Americans (66%) begin decorating at least three weeks before Halloween, with more than 30% starting a month or more in advance.
On average, households spend about five hours setting up displays, and more than 75% spend at least $50 on décor, with 27% dropping $200 or more to make their homes stand out. Whether it’s twinkling lights across the roofline or a towering inflatable skeleton in the yard, these investments reflect how much pride people take in presenting their homes to the neighborhood.
The celebration doesn’t stop at décor. Halloween is also about community and generosity. Roughly half of households see 11–50 trick-or-treaters each year, while one in four welcome more than 50 visitors. To match the demand, more than two-thirds of Americans (68%) plan to hand out candy this year, with about 1 in 5 (22%) saying they spend $50 or more on candy each year.
Nearly half (44%) give out one to three pieces, 27% hand out a full handful, and 5% go all out with full-size candy bars. Even when families aren’t home on Halloween night, 37% say they’ll still leave out candy to keep the tradition alive.
Halloween is also a chance for homeowners to step into character. About 35% dress up when handing out candy, and 35% participate in neighborhood or community events, reinforcing how Halloween spirit extends beyond the front door.
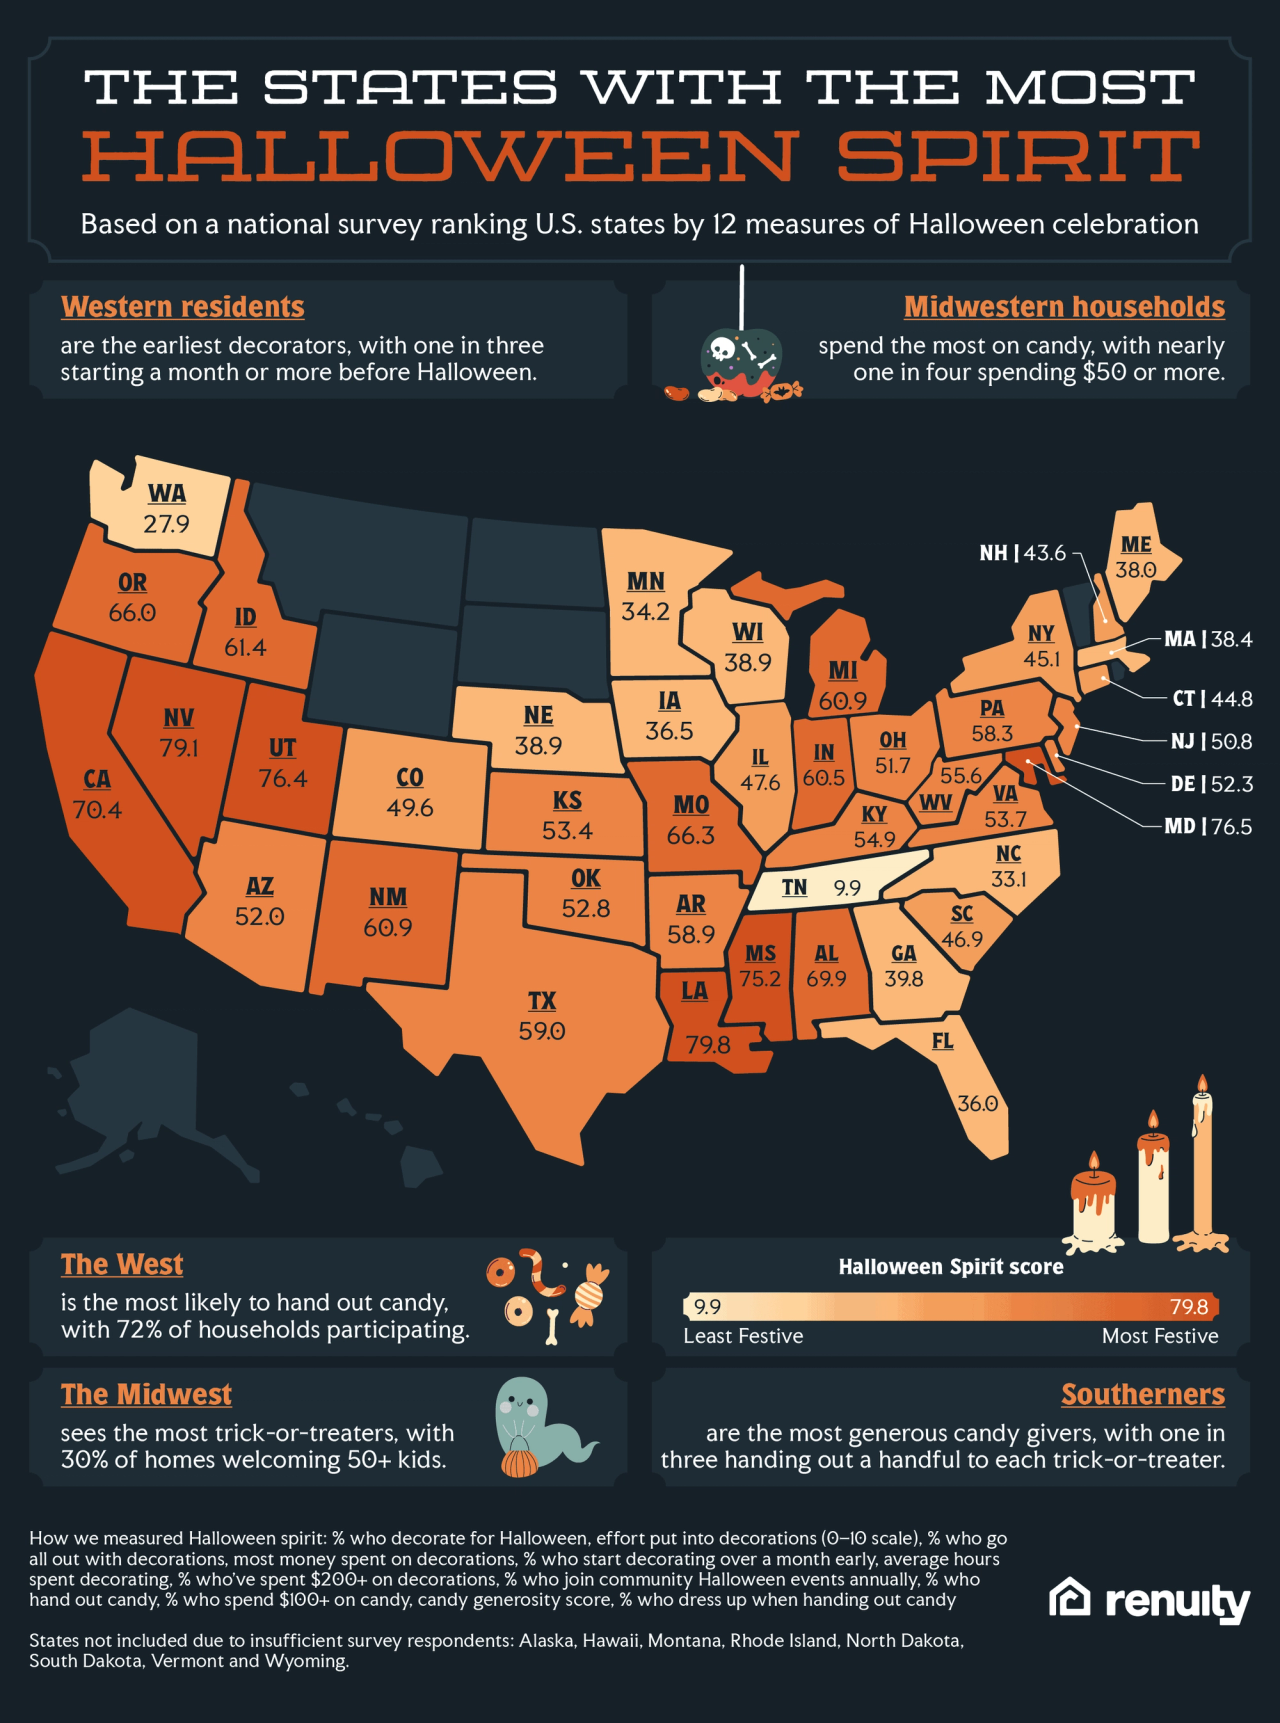
When it comes to Halloween spirit, not every state approaches the holiday the same way. Some go all in with elaborate displays, while others keep it low-key.
We ranked each state for Halloween spirit based on how they responded to 12 survey questions — from how early households start decorating to how much they spend on candy — here’s a look at the states that put the most and least effort into transforming their homes for the spooky season.
Louisiana
Nevada
Maryland
Utah
Mississippi
These top states share a commitment to turning their homes into festive landmarks. Residents of Utah stand out for their early start, with more than a third decorating a month ahead — proving preparation is as much a tradition as pumpkins.
Louisiana and Nevada show their dedication through financial investment, with roughly a third of households spending $200 or more on decorations. Community spirit also shines through: Mississippi leads with over half of households taking part in neighborhood Halloween events, while more than half of Maryland households leave candy out even when they’re away, ensuring no trick-or-treater goes empty-handed.
Tennessee
Washington
North Carolina
Minnesota
Florida
On the other side of the spectrum, the bottom-ranking states reveal a more restrained approach to the holiday. Tennessee and Washington show the lowest investment of time, with households averaging under two hours of decorating.
North Carolina leads the nation in skipping decorations altogether, while Minnesota is more of a last-minute decorator, with nearly a third waiting until the week of Halloween.
Meanwhile, Florida households prioritize simplicity, with the majority spending less than $20 on candy and opting out of community events. Together, these states highlight that not every neighborhood transforms into a haunted wonderland — some prefer to keep things understated.
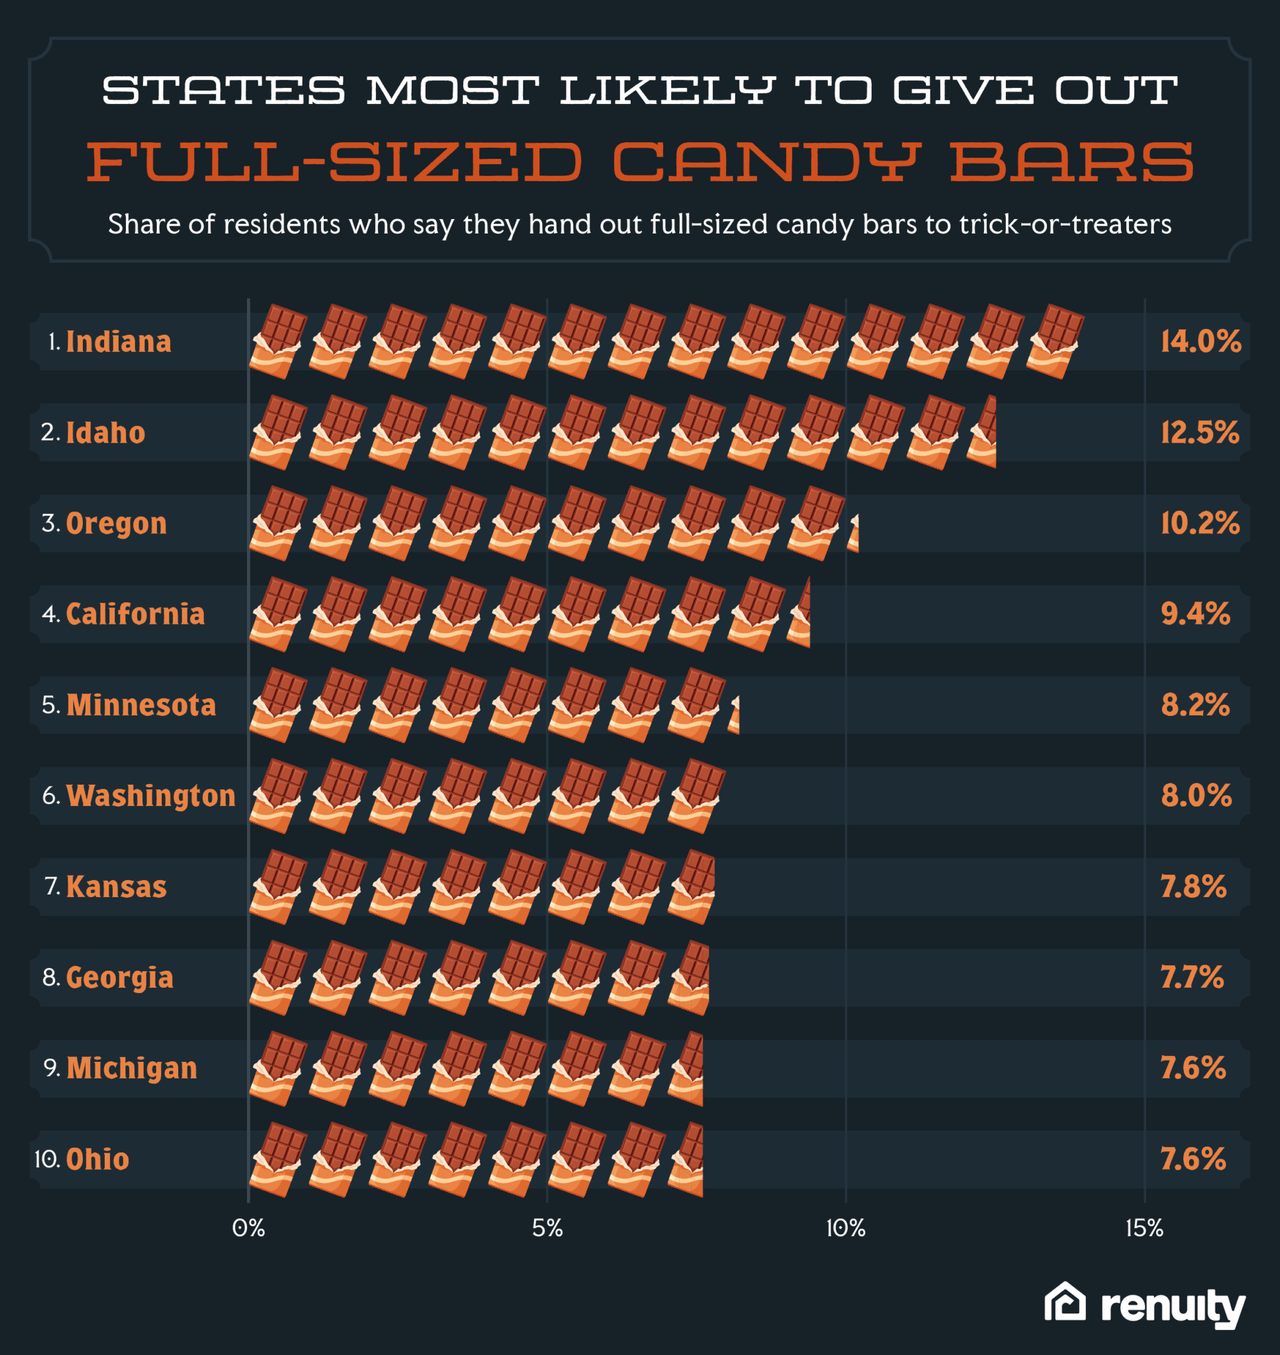
For kids on the hunt for the ultimate Halloween treat, nothing beats a full-sized candy bar. While most households stick to a few fun-size pieces, a handful of states stand out for their generosity.
These states prove that bigger really is better on Halloween night. Households in Indiana and Idaho lead the pack, with more than one in ten residents saying they hand out full-sized bars. Out West, Oregon and California also show a flair for generosity, while Minnesota sneaks into the top five — sweetening the deal for trick-or-treaters in the Midwest. For homeowners, the choice to go big reflects not just a love of candy but also pride in creating a memorable experience right at their doorstep.
Halloween decorating may be a nationwide tradition, but the way homeowners celebrate varies by region. In the West, homeowners are most likely to go all out with their decorations, with 23% saying they decorate extensively, compared to 21% in the South and Midwest and just 16% in the Northeast. Westerners also start earlier, with 33% decorating a month or more in advance, outpacing other regions.
The South takes pride in spectacle, spending the most on yard inflatables and props (22%), far ahead of the rest of the country. Southerners also dedicate the most time to their displays, averaging 5 hours and 38 minutes, compared to the Northeast who average the shortest amount of time at 4 hours and 8 minutes. Community spirit is strongest in the South, with 39% joining neighborhood Halloween events, compared to 35% in the Northeast and West and 32% in the Midwest.
When it comes to spending, the West is home to the biggest décor investors, with 44% spending $150 or more, followed closely by the South and Midwest (39%). The Midwest, meanwhile, leads in candy generosity and foot traffic: 30% of households welcome 50+ trick-or-treaters, and 24% spend $50 or more stocking up on sweets. Southerners top the list for handing out larger portions, with 33% giving a handful of candy, compared to 26% in the West, 25% in the Midwest, and 23% in the Northeast.
Other regional quirks round out the picture. Northeasterners are the most likely to leave out candy when away (44%), while Westerners are the most consistent candy givers overall (72% plan to participate). Costumes are also a part of the porch experience: 37% of Southerners and Westerners dress up when handing out candy, compared to 34% in the Northeast and 32% in the Midwest.
At Renuity, we believe that spirit doesn’t have to end on November 1. Just as lights, pumpkins, and porch displays showcase creativity during Halloween, remodeling is another way families transform their spaces in lasting ways. This study highlights how much effort Americans put into making their homes stand out for Halloween — and how central the home is to community, celebration, and creativity.
The same energy that inspires glowing jack-o’-lanterns or elaborate yard inflatables can also spark lasting improvements. Whether it’s custom closets or home storage solutions to store next year’s Halloween décor haul, durable floor coatings to protect the garage, or a reimagined spa-inspired bathroom to recuperate from Halloween festivities, Renuity helps families enhance comfort, function, and curb appeal to create spaces they’re proud to share all year long.
This study is based on a survey of 2,095 U.S. respondents conducted in fall 2025. To rank the states with the most Halloween spirit, we analyzed 12 factors related to decorating habits, spending, candy-giving, and community participation. Each factor was weighted and combined to create a total score for every state.
Here is the full list of the 12 Halloween spirit ranking factors we used:
Due to insufficient sample sizes, the following states were not included in the ranking: Alaska, Hawaii, Montana, Rhode Island, North Dakota, South Dakota, Vermont, and Wyoming.
You are welcome to use, reference, and share non-commercial excerpts of this study with proper attribution. If you cite or cover our findings, please link back to this page so readers can view the full methodology, charts, and context.

As a content manager at Renuity, Francheska spent nearly two years helping homeowners discover the possibilities of transforming their spaces. Renuity is a leader in home remodeling, specializing in everything from windows and doors to bathrooms and home storage solutions, and she’s proud to be part of a team that prioritizes quality, innovation, and customer satisfaction. She graduated from Florida International University with a double major in International Business and Marketing, ranked among the top programs in the nation. Her passion for home improvement runs deep—since childhood, she’s been inspired by watching HGTV and seeing the magic of remodels come to life. Now, she channels that passion into connecting readers with ideas, tips, and solutions to create homes they love.
Renuity is backed by top industry ratings and trusted by homeowners nationwide for quality, service, and reliability.


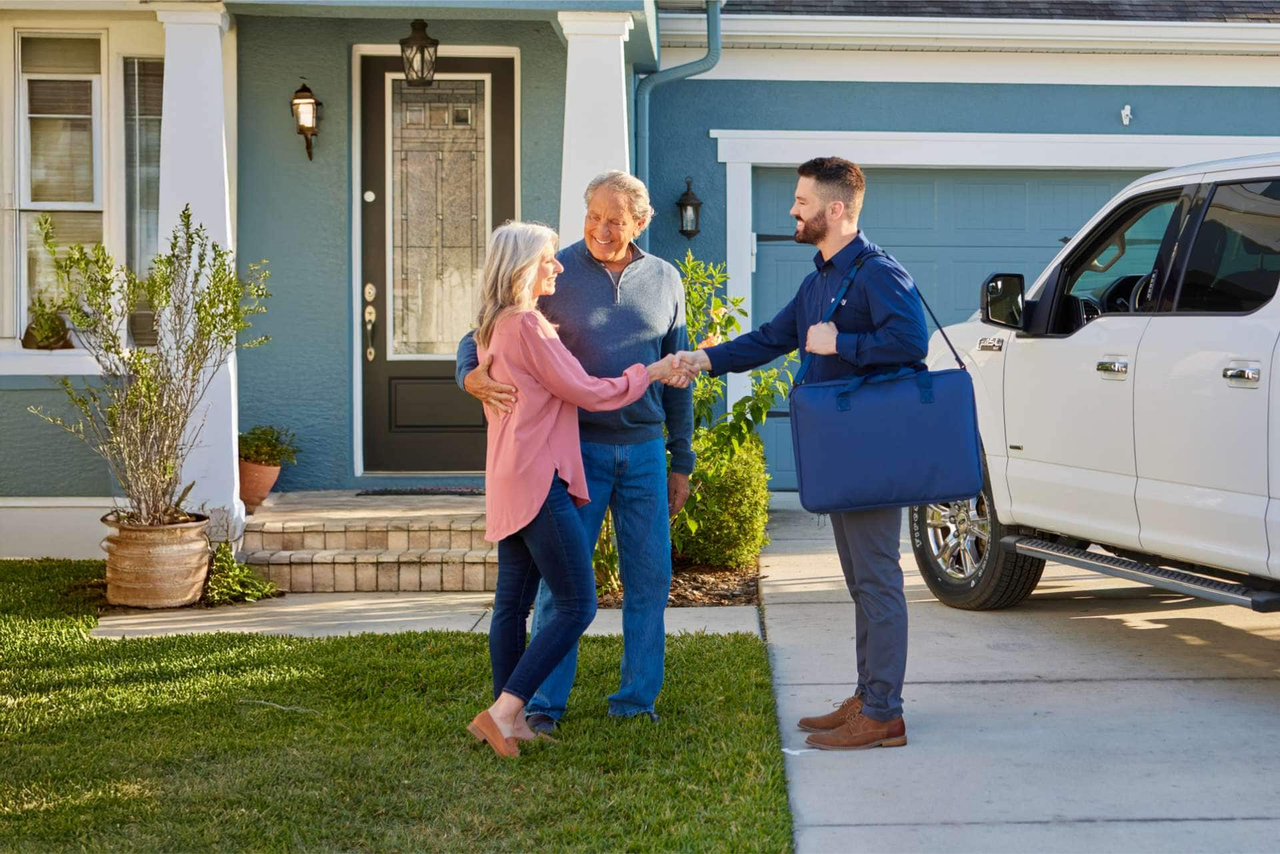
Get a free, no-obligation estimate and see how easy it is to upgrade to your dream home. One of our local specialists will reach out to schedule your consultation—on your terms.
At Renuity, our greatest pride comes from the trust homeowners place in us and the lasting results we deliver. From seamless installations to transformative home upgrades, we’re committed to making every project simple, stress-free, and built to last. Our family of regional brands includes some of the most respected names in remodeling nationwide, all united by proven expertise and a shared commitment to exceptional service. See how we’ve made a difference for families nationwide and what they have to say about their experiences with Renuity.
Very professional, pleasant, ahead of schedule . Dealing with Danny Guthrie was pleasant and answered all our questions. Their were no other surprise costs. We loved the service, the contractors wer...
All the people we have dealt with from Renuity from the sales rep, office administration & the installers, have been very good to deal with. On the first day of the installation, they found dry rot un...
This was a very pleasant experience. Lance, my salesperson, was very professional and understood my concerns and needs. Blake and Sebastian, the installers of my new shower remodel, were friendly, har...
We have used Renuity Home Improvement (formerly FHIA) five different times, and every experience has been excellent. They replaced the windows in our previous two homes, completed our parents’ two hom...
We are so pleased with our new shower ! The installing crew were friendly, professional and on time. The appearance of the modern shower is so lovely. We would recommend this company 100% if you wa...
Excellent salesman Wesley was .kind, friendly and knowledgeable...great guy. The brothers were Excellent and beyond, superb work by them and they were fast with the installation. No better place to h...
We had a roof and windows installed by this company. We had 4 companies we were interviewing. FHIA was the second one we met with. Josh came to our home to present their products and servies to us. I...
Great workmanship. Great job. The workers was very professional and explained the installation. Clean up after the job was completed. I would definitely recommend this crew to anyone interest. Thanks...
Conde was very nice and professional with his work , and they kept me informed of the job as it went forward. These are nice windows that should be trouble free for a long time. They were thorough thr...
Now that windows all installed I am pleased with the work, clean up, craftsmanship of products I am pleased. Conscientious of others property. Installed with great care of surroundings. Do recommend...


