

Trusted By Over 250,000 Customers!
No Interest, No Payments for 12 months on Select Products
No Interest, No Payments for 12 months on Select Products
In this lighthearted yet data-driven analysis, we’ve ranked the 100 most populous U.S. cities based on their “couch-friendliness.” We considered factors such as broadband availability, food and grocery delivery options, remote job opportunities, and weather conditions that encourage staying indoors. Whether you’re a homebody by choice or circumstance, this ranking will reveal the ultimate cities for cozy, at-home living.
What does it take to make a city perfect for embracing a life of leisure? We measured how well a city removes the three biggest reasons to go outside—spotty internet, great weather, and empty cupboards—and how effectively they turn staying in into a pleasure, not a compromise.
Fast, affordable internet is the first step. Cities with high broadband coverage, fast average speeds, and reasonable monthly costs make it easy to stream, game, or work without lag or bill shock. We also looked at the number of takeout-friendly restaurants per capita, because when your fridge is empty, food that comes to you is a lifeline. A high share of remote workers suggests that local infrastructure and culture already support a stay-at-home lifestyle.
Comfort is key, too. Cities with larger, more affordable homes offer space for a sectional sofa and a giant TV—essentials for any dedicated homebody. A high number of furniture stores per capita makes it easy to level up your living room. We also looked at a city’s walk score; fewer walkable amenities mean fewer temptations to leave the house.
Weather also plays a role; cities with frequent rainy days offer a built-in excuse to stay cozy indoors. A higher percentage of physically inactive adults suggests a culture that embraces relaxation. And more hobby, toy, and game stores per capita means easy access to puzzles, board games, and video game fuel for an ideal weekend of lounging.
Put it all together, and these metrics reveal the cities where high-speed Wi-Fi, endless takeout, cozy homes, and dreary weather combine to create the ultimate couch potato paradise.

When it comes to seamless streaming, endless take-out options, and homes built for cozy contentment, these 15 cities stand out from the crowd. Each earned top marks across key criteria, including broadband coverage, remote work readiness, home size, and furniture access. Whether it’s the rainy-day weather in Wilmington, NC, the high share of remote workers in Austin, TX, or the abundance of takeout-friendly restaurants in Durham, NC, these metro areas create the perfect backdrop for a homebody lifestyle.
The top performers also share common threads: affordable housing, fast internet, and a built environment that subtly discourages constant outings. Salt Lake City, UT, and Colorado Springs, CO, for instance, blend spacious living with moderate climates that are ideal for indoor hobbies. North Carolina cities dominate the list, claiming four of the top 10 spots. Raleigh, Winston-Salem, and Wilmington complement Durham’s strong showing, cementing the state’s reputation as a haven for those who thrive indoors.
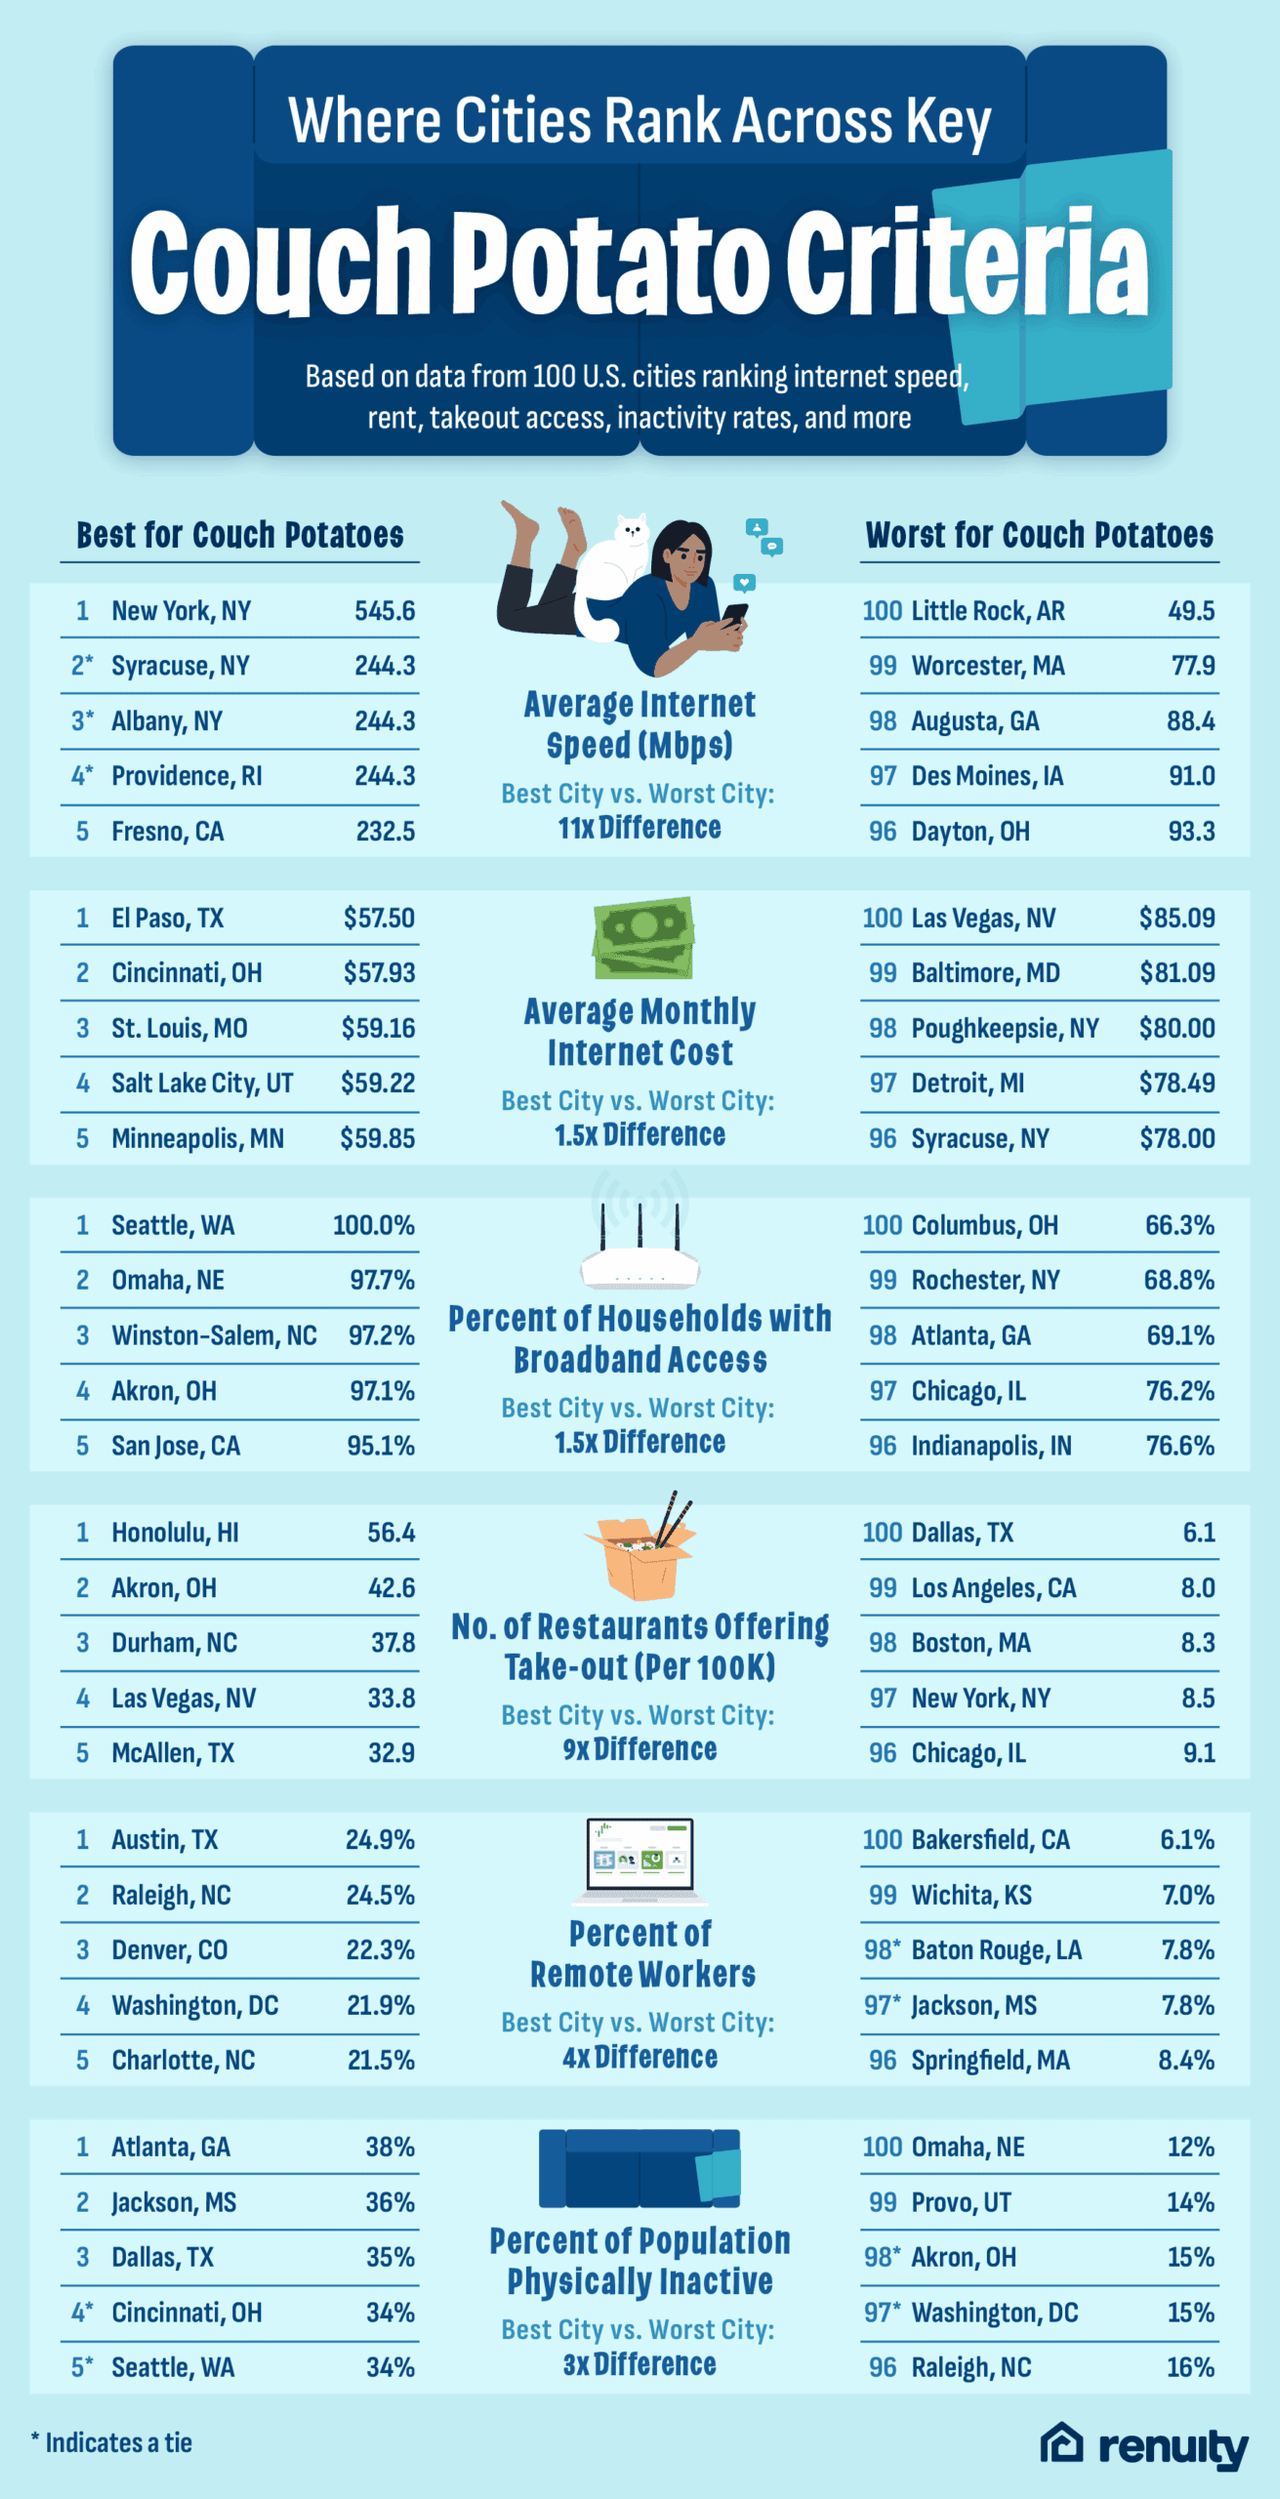
While our overall ranking highlights the top cities for full-time lounging, we also wanted to zoom in on specific couch-potato criteria to see which cities shine, or struggle, in key categories. From internet speed and takeout access to remote work culture and physical activity levels, these city-level callouts reveal how different places stack up when it comes to enabling a life of maximum comfort and minimal effort.
New York State cities dominate in internet speed, driven by dense infrastructure and competitive broadband markets. Even smaller metros like Syracuse and Albany benefit from regional investment in fiber networks.
These cities struggle with slower speeds, likely due to aging infrastructure or limited provider options. Gaps in digital investment may be holding them back from more reliable at-home connectivity.
These cities offer the most affordable internet service, helped by lower living costs and stronger provider competition. For budget-conscious homebodies, this keeps streaming and remote work within reach.
Higher internet costs in these metros could stem from limited provider choice or higher baseline service tiers. In some cases, residents may be paying a premium for basic connectivity.
These cities boast high broadband coverage, suggesting strong infrastructure and high digital adoption. Even smaller metros like Winston-Salem show what’s possible with targeted investment.
Despite their size, these cities have lower broadband access—often tied to income disparities or under-resourced neighborhoods. The digital divide remains a challenge even in urban areas.
A strong takeout culture defines these cities, where residents have easy access to food delivery options. In places like Durham, a growing restaurant scene helps reinforce its stay-at-home appeal.
Large populations don’t always mean better takeout access. Factors like traffic, zoning restrictions, and urban sprawl may limit restaurant density in these metros.
Tech-forward cities like Austin and Raleigh continue to lead the remote work movement. A high share of WFH residents reflects a lifestyle that’s already centered around staying home.
These metros are tied to industries that require in-person work, like agriculture, energy, and manufacturing. Remote-friendly infrastructure may be less developed in these regions.
High inactivity rates in these cities point to cultural and environmental factors—like car reliance or limited walkability—that support more sedentary routines. For couch potatoes, that means fewer reasons to venture out.
Residents in these cities are more active overall, possibly due to younger demographics or more outdoor-oriented lifestyles. Still, these metros manage to balance activity with convenience and comfort.
Whether you’re working from home, binge-watching your favorite shows, or simply spending more time indoors, your space plays a big role in your comfort. Renuity offers home upgrades that support this lifestyle—from custom closets that reduce clutter to home storage and garage storage systems that make everyday living more functional. In the cities where staying in is the norm, these upgrades can help make your home even more enjoyable.
We ranked the 100 largest U.S. metros on 12 data points tied to streaming quality, food convenience, and indoor comfort. Each metric was scaled from 0 to 5, multiplied by the weight below, and summed for a 0–100 Couch-Potato Score (higher = easier life on the sofa).
Percent of Households with Broadband Access
Average Internet Speed
Average Monthly Internet Cost
Percent of Remote Workers
Restaurants Offering Take-out per Capita
Walk Score
Average Rent
Median Home Size
Furniture Stores per Capita
Percent of Adults Physically Inactive
Annual Days of Rain
Hobby, Toy & Game Stores per Capita

As a content manager at Renuity, Francheska spent nearly two years helping homeowners discover the possibilities of transforming their spaces. Renuity is a leader in home remodeling, specializing in everything from windows and doors to bathrooms and home storage solutions, and she’s proud to be part of a team that prioritizes quality, innovation, and customer satisfaction. She graduated from Florida International University with a double major in International Business and Marketing, ranked among the top programs in the nation. Her passion for home improvement runs deep—since childhood, she’s been inspired by watching HGTV and seeing the magic of remodels come to life. Now, she channels that passion into connecting readers with ideas, tips, and solutions to create homes they love.
Renuity is backed by top industry ratings and trusted by homeowners nationwide for quality, service, and reliability.


Get a free, no-obligation estimate and see how easy it is to upgrade to your dream home. One of our local specialists will reach out to schedule your consultation—on your terms.
At Renuity, our greatest pride comes from the trust homeowners place in us and the lasting results we deliver. From seamless installations to transformative home upgrades, we’re committed to making every project simple, stress-free, and built to last. Our family of regional brands includes some of the most respected names in remodeling nationwide, all united by proven expertise and a shared commitment to exceptional service. See how we’ve made a difference for families nationwide and what they have to say about their experiences with Renuity.

Very professional, pleasant, ahead of schedule . Dealing with Danny Guthrie was pleasant and answered all our questions. Their were no other surprise costs. We loved the service, the contractors wer...
All the people we have dealt with from Renuity from the sales rep, office administration & the installers, have been very good to deal with. On the first day of the installation, they found dry rot un...
This was a very pleasant experience. Lance, my salesperson, was very professional and understood my concerns and needs. Blake and Sebastian, the installers of my new shower remodel, were friendly, har...
We have used Renuity Home Improvement (formerly FHIA) five different times, and every experience has been excellent. They replaced the windows in our previous two homes, completed our parents’ two hom...
We are so pleased with our new shower ! The installing crew were friendly, professional and on time. The appearance of the modern shower is so lovely. We would recommend this company 100% if you wa...
Excellent salesman Wesley was .kind, friendly and knowledgeable...great guy. The brothers were Excellent and beyond, superb work by them and they were fast with the installation. No better place to h...
We had a roof and windows installed by this company. We had 4 companies we were interviewing. FHIA was the second one we met with. Josh came to our home to present their products and servies to us. I...
Great workmanship. Great job. The workers was very professional and explained the installation. Clean up after the job was completed. I would definitely recommend this crew to anyone interest. Thanks...
Conde was very nice and professional with his work , and they kept me informed of the job as it went forward. These are nice windows that should be trouble free for a long time. They were thorough thr...
Now that windows all installed I am pleased with the work, clean up, craftsmanship of products I am pleased. Conscientious of others property. Installed with great care of surroundings. Do recommend...


